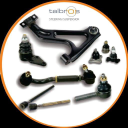
Talbros Automotive Components (TALBROAUTO) Stock Overview
Talbros Automotive Components Limited engages in the manufacture and sale of auto components in India. It offers multi-layer steel, post coated/selective area coated, exhaust/hot, rubber/edge molded, fiber, and heat shield gaskets, as well as gaskets with electrical control; forging products, such as towing solutions, intermediate shaft & differential housing, crafting hydraulic end caps and rod eyes, blank ring gears, companion flanges, and engineering king pins and linear cylinders, as well as tube and flange yokes; and chassis components, including control arm, suspension links, front cross member, rear twist-beam axle, cradle, wheel group, and semi corner module assemblies. The company also provides mounting muffler hangers, suspension bushings, body and cab mounts, molded hoses for air cleaners, and engineering bushings for leading and trailing arms, as well as extrusion hoses for air, fuel, and water. Its products are used in passenger and commercial vehicles, two-wheelers, three-wheelers, agricultural machinery, off-loaders, and industrial vehicles. The company also exports its products. Talbros Automotive Components Limited was incorporated in 1956 and is based in Gurugram, India.
TALBROAUTO Stock Information
Talbros Automotive Components (TALBROAUTO) Price Chart
Talbros Automotive Components Overview: Key Details and Summary
Stock data | 2025 | Change |
|---|---|---|
| Price | $3.68 | N/A |
| Market Cap | $227.22M | N/A |
| Shares Outstanding | 61.73M | N/A |
| Employees | 610.00 | N/A |

